##
前言
kube-router是由CNCF官方孵化的CNI插件项目,灵活度很高,支持Service网段、pod网段bgp宣告,与集群内外构建直连网络,同时支持ipvs Service代理,目前已有不少大中型公司采用此CNI,github的star数量已经超越calico,因此决定采用kube-router的cni解决方案。
IPVS Service
kube-router本身提供ipvs模式的service代理,默认与Kube-proxy的ipvs模式可以说是几乎一致的,都为ipvs nat模式,但kube-router额外提供ipvs的DR(direct return)模式,需配合tunnel模式和Service annotation使用。网络组件过多反而会导致故障不易排查,因此,直接使用kube-router官方推荐的ipvs Service模式,弃用kube-proxy。
删除kube-proxy1
2KUBECONFIG=/etc/kubernetes/admin.conf kubectl -n kube-system delete ds kube-proxy
docker run --privileged -v /lib/modules:/lib/modules --net=host k8s.gcr.io/kube-proxy-amd64:v1.14.3 kube-proxy --cleanup
kuberouter ipvs的工作模式
kube-router会自动发现Service资源与endpoint资源,创建相应的ipvs条目,ipvs条目中的vip是Service的ClusterIP,realServer是Serivce关联的endpoints.1
2
3
4
5
6
7
8
9
10
11
12
13
14
15# service
$:~# kubectl get svc | grep 10.96.20.77
svc1 ClusterIP 10.96.20.77 <none> 80/TCP 92d
# endpoint
$:~# kubectl get ep svc1
NAME ENDPOINTS AGE
svc1 172.26.13.31:80,172.26.2.54:80,172.26.5.46:80 92d
# kube-router自动创建ipvs条目
$ ipvsadm
TCP 10.96.20.77:http rr
-> 172.26.2.54:http Masq 1 0 0
-> 172.26.5.46:http Masq 1 0 0
-> 172.26.13.31:http Masq 1 0 0
同时若配置好了bgp网络,会将Service ClusterIP通过bgp路由宣告出去,进入kube-router容器内部查看宣告的路由表:1
2$:~ #gobgp global rib | grep 10.96.20.77
*> 10.96.20.77/32 192.168.9.27 00:02:08 [{Origin: i}]
流量是如何转发给ipvs的?
流量是如何转发到direct server的呢?查看direct server的接口,你会发现多了一个虚拟接口,地址正是service clusterIP:1
2$:~# ip a | grep 10.96.20.77
inet 10.96.20.77/32 brd 10.96.20.77 scope link kube-dummy-if
假设你的路由已经都配置好了,发往service clusterIP的流量被送达了direct server,那么它是如何处理流量将其转发给内核的ipvs模块的呢?
来看看iptables吧,你会发现kube-router在iptables里新建了一个chain:1
2
3
4
5Chain KUBE-ROUTER-SERVICES (1 references)
target prot opt source destination
ACCEPT all -- anywhere anywhere /* allow input traffic to ipvs services */ match-set kube-router-ipvs-services dst,dst
ACCEPT icmp -- anywhere anywhere /* allow icmp echo requests to service IPs */ icmp echo-request
REJECT all -- anywhere anywhere /* reject all unexpected traffic to service IPs */ ! match-set kube-router-local-ips dst reject-with icmp-port-unreachable
注释中有写,它是将去往services clusterIP的流量转发进下一步,其余的流量会过滤掉,那么它是怎么匹配到services clusterIP的呢?iptabels里面并没有其他的规则了呀,答案是ipset:1
2$:~# ipset list kube-router-ipvs-services | grep 10.96.20.77
10.96.20.77,tcp:80 timeout 0
匹配到ipset里的条目,则正常转发进入ipvs内核模块
抓包验证
了解完了上面的工作模式,光说理论也不行,下面就来实际抓包验证一下吧,分三种模式分别抓包:
- 集群外部访问Service ClusterIP
- 集群外部通过Ingress http访问集群内服务
- 集群内部访问Service ClusterIP
bgp网络直通方案(三层)
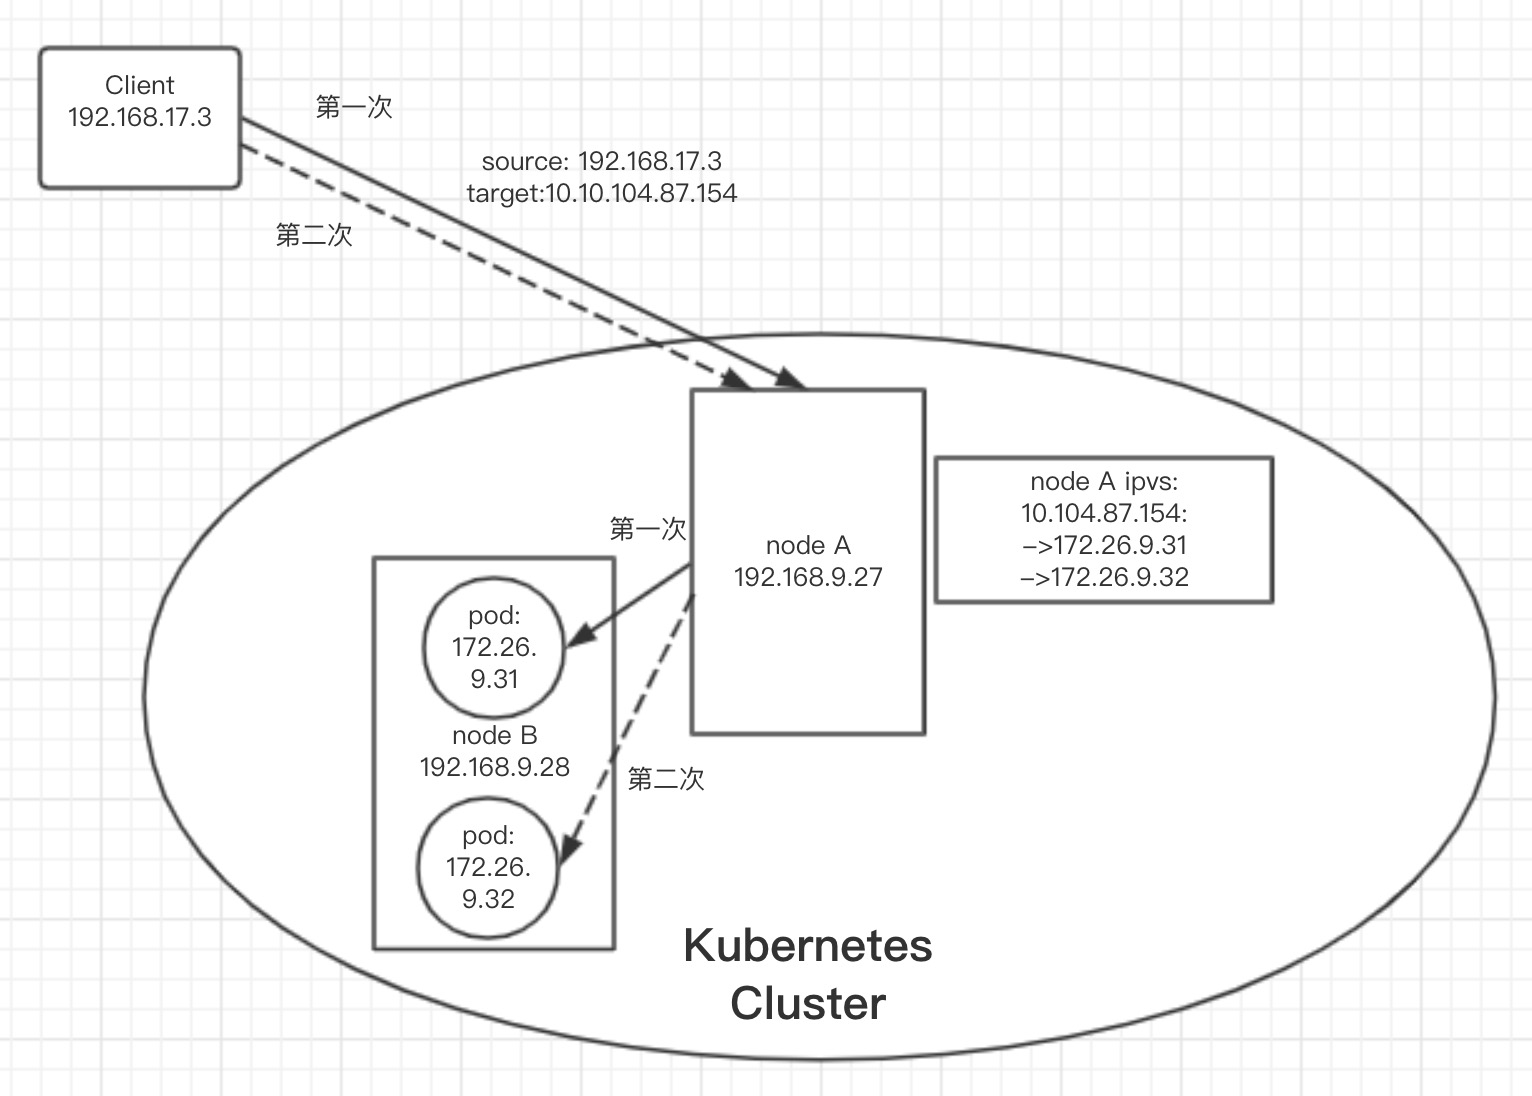
集群外部访问Service ClusterIP
环境:
1 | client: 192.168.17.3 #集群外 |
ipvs条目:
1 | TCP 10.104.87.154:http rr |
部署好pod上的http服务后,首先在client端发起两次curl http请求,同时在service入口的主机上抓包:1
2
3
4
5
6
7
8
9
10
11
12
13
14
15
16
17
18
19
20$:~# tcpdump host 10.104.87.154 or host 172.26.9.31 or host 172.26.9.32
tcpdump: verbose output suppressed, use -v or -vv for full protocol decode
listening on bond0, link-type EN10MB (Ethernet), capture size 262144 bytes
17:10:34.272343 IP 192.168.17.4.53643 > 10.104.87.154.http: Flags [S], seq 478846184, win 65535, options [mss 1460,nop,wscale 6,nop,nop,TS val 1042528917 ecr 0,sackOK,eol], length 0
17:10:34.272364 IP yksp009027.youkeshu.com.53643 > 172.26.9.31.http: Flags [S], seq 478846184, win 65535, options [mss 1460,nop,wscale 6,nop,nop,TS val 1042528917 ecr 0,sackOK,eol], length 0
17:10:34.273032 IP 172.26.9.31.http > yksp009027.youkeshu.com.53643: Flags [S.], seq 420235101, ack 478846185, win 16060, options [mss 1460,nop,nop,sackOK,nop,wscale 6], length 0
17:10:34.273040 IP 10.104.87.154.http > 192.168.17.4.53643: Flags [S.], seq 420235101, ack 478846185, win 16060, options [mss 1460,nop,nop,sackOK,nop,wscale 6], length 0
17:10:34.273371 IP 192.168.17.4.53643 > 10.104.87.154.http: Flags [.], ack 1, win 4096, length 0
17:10:34.273379 IP yksp009027.youkeshu.com.53643 > 172.26.9.31.http: Flags [.], ack 1, win 4096, length 0
17:10:34.273447 IP 192.168.17.4.53643 > 10.104.87.154.http: Flags [P.], seq 1:78, ack 1, win 4096, length 77: HTTP: GET / HTTP/1.1
17:12:23.661092 IP 192.168.17.4.53644 > 10.104.87.154.http: Flags [S], seq 1822033847, win 65535, options [mss 1460,nop,wscale 6,nop,nop,TS val 1042638076 ecr 0,sackOK,eol], length 0
17:12:23.661110 IP yksp009027.youkeshu.com.53644 > 172.26.9.32.http: Flags [S], seq 1822033847, win 65535, options [mss 1460,nop,wscale 6,nop,nop,TS val 1042638076 ecr 0,sackOK,eol], length 0
17:12:23.661248 IP 172.26.9.32.http > yksp009027.youkeshu.com.53644: Flags [S.], seq 1318960293, ack 1822033848, win 16060, options [mss 1460,nop,nop,sackOK,nop,wscale 6], length 0
17:12:23.661256 IP 10.104.87.154.http > 192.168.17.4.53644: Flags [S.], seq 1318960293, ack 1822033848, win 16060, options [mss 1460,nop,nop,sackOK,nop,wscale 6], length 0
17:12:23.661471 IP 192.168.17.4.53644 > 10.104.87.154.http: Flags [.], ack 1, win 4096, length 0
17:12:23.661482 IP yksp009027.youkeshu.com.53644 > 172.26.9.32.http: Flags [.], ack 1, win 4096, length 0
17:12:23.661557 IP 192.168.17.4.53644 > 10.104.87.154.http: Flags [P.], seq 1:78, ack 1, win 4096, length 77: HTTP: GET / HTTP/1.1
17:12:23.661563 IP yksp009027.youkeshu.com.53644 > 172.26.9.32.http: Flags [P.], seq 1:78, ack 1, win 4096, length 77: HTTP: GET / HTTP/1.1
通过抓包结果可以看到,标准的ipvs nat模式,5个步骤:
1 | 1.源client ip -> 目的direct server |
示意图
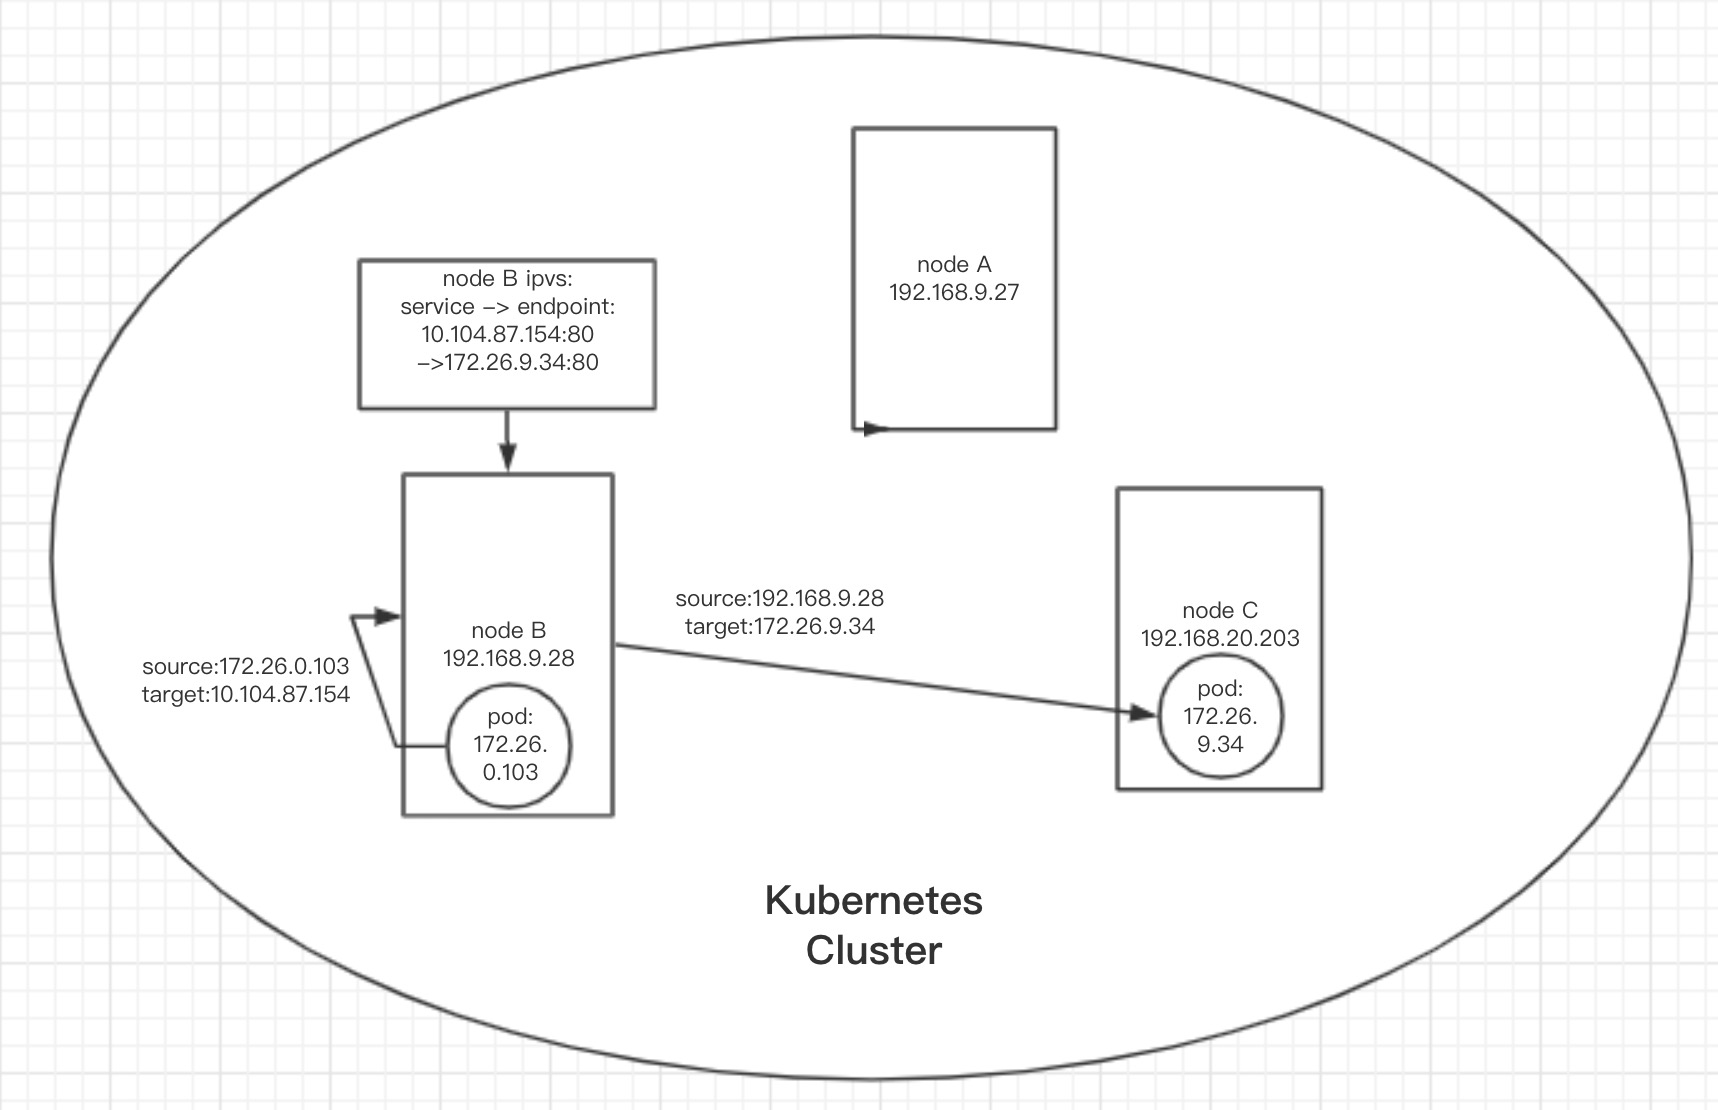
集群内部访问Service ClusterIP
环境:
1 | client: 172.26.0.103 #集群内pod |
ipvs条目:
1 | TCP 10.104.87.154:http rr |
部署好endpoint pod上的http服务后,首先在client pod端发起curl http请求:curl 10.104.87.154
在client pod所在node、service入口(direct server)主机上和endpoint pod内部同时一起抓包:1
2
3
4
5
6
7
8
9
10
11
12
13
14
15
16
17
18
19
20
21
22
23
24
25
26
27
28
29
30# 192.168.9.27
$:~# tcpdump host 10.104.87.154 or host 172.26.9.34 and port 80
tcpdump: verbose output suppressed, use -v or -vv for full protocol decode
listening on bond0, link-type EN10MB (Ethernet), capture size 262144 bytes
# 192.168.9.28 ,client pod所在node
$:~# tcpdump host 10.104.87.154 or host 172.26.9.34 and port 80
tcpdump: verbose output suppressed, use -v or -vv for full protocol decode
listening on bond0, link-type EN10MB (Ethernet), capture size 262144 bytes
17:22:08.200255 IP 172.26.0.103.59848 > 172.26.9.34.http: Flags [S], seq 2739388076, win 16060, options [mss 1460,nop,nop,sackOK,nop,wscale 6], length 0
17:22:08.227382 IP 172.26.9.34.http > 172.26.0.103.59848: Flags [S.], seq 1541751593, ack 2739388077, win 16060, options [mss 1460,nop,nop,sackOK,nop,wscale 6], length 0
17:22:08.227456 IP 172.26.0.103.59848 > 172.26.9.34.http: Flags [.], ack 1, win 251, length 0
17:22:08.227588 IP 172.26.0.103.59848 > 172.26.9.34.http: Flags [P.], seq 1:78, ack 1, win 251, length 77: HTTP: GET / HTTP/1.1
17:22:08.256779 IP 172.26.9.34.http > 172.26.0.103.59848: Flags [.], ack 78, win 251, length 0
17:22:08.257093 IP 172.26.9.34.http > 172.26.0.103.59848: Flags [P.], seq 1:311, ack 78, win 251, length 310: HTTP: HTTP/1.1 403 Forbidden
17:22:08.257136 IP 172.26.0.103.59848 > 172.26.9.34.http: Flags [.], ack 311, win 268, length 0
17:22:08.285245 IP 172.26.9.34.http > 172.26.0.103.59848: Flags [F.], seq 311, ack 79, win 251, length 0
17:22:08.285297 IP 172.26.0.103.59848 > 172.26.9.34.http: Flags [.], ack 312, win 268, length 0
# endpoint pod 172.26.9.34
root@gittestdev-65f985fdcb-tplj2:~# tcpdump port 80
tcpdump: verbose output suppressed, use -v or -vv for full protocol decode
listening on eth0, link-type EN10MB (Ethernet), capture size 262144 bytes
09:15:26.939961 IP 172.26.0.103.52736 > gittestdev-65f985fdcb-tplj2.http: Flags [S], seq 3722842581, win 16060, options [mss 1460,nop,nop,sackOK,nop,wscale 6], length 0
09:15:26.940024 IP gittestdev-65f985fdcb-tplj2.http > 172.26.0.103.52736: Flags [S.], seq 4165097507, ack 3722842582, win 16060, options [mss 1460,nop,nop,sackOK,nop,wscale 6], length 0
09:15:26.940199 IP 172.26.0.103.52736 > gittestdev-65f985fdcb-tplj2.http: Flags [.], ack 1, win 251, length 0
09:15:26.940266 IP 172.26.0.103.52736 > gittestdev-65f985fdcb-tplj2.http: Flags [P.], seq 1:78, ack 1, win 251, length 77: HTTP: GET / HTTP/1.1
09:15:26.940291 IP gittestdev-65f985fdcb-tplj2.http > 172.26.0.103.52736: Flags [.], ack 78, win 251, length 0
09:15:26.941167 IP gittestdev-65f985fdcb-tplj2.http > 172.26.0.103.52736: Flags [P.], seq 1:311, ack 78, win 251, length 310: HTTP: HTTP/1.1 403 Forbidden
09:15:26.941375 IP 172.26.0.103.52736 > gittestdev-65f985fdcb-tplj2.http: Flags [.], ack 311, win 268, length 0
查看client pod所在node上的ipvs会话信息是否包含刚访问的vip:
1 | root@yksp009028:~# ipvsadm -lnc | grep 10.104.87.154 |
从以上几处结果可以总结出:
去往vip的路由指向的默认direct server上没有流量经过;
client pod发起(172.26.0.103) 去往Service ClusterIP(10.104.87.154)的数据包,它所属的node在转发前,读取ipvs条目,根据ipvs条目内的信息,将数据包的目的地转换成了后端pod的地址,然后直接使用3层网络转发,将数据包转发到了后端pod。即数据包在本机内就已经基于ipvs,将目的地址从vip转换成了real server ip,出本机后是基于real server ip走的3层路由。
综上,集群内部service调用,走的是基于real server ip的路由,而不是如上面案例中的集群外部调用一样走基于vip的路由。
示意图
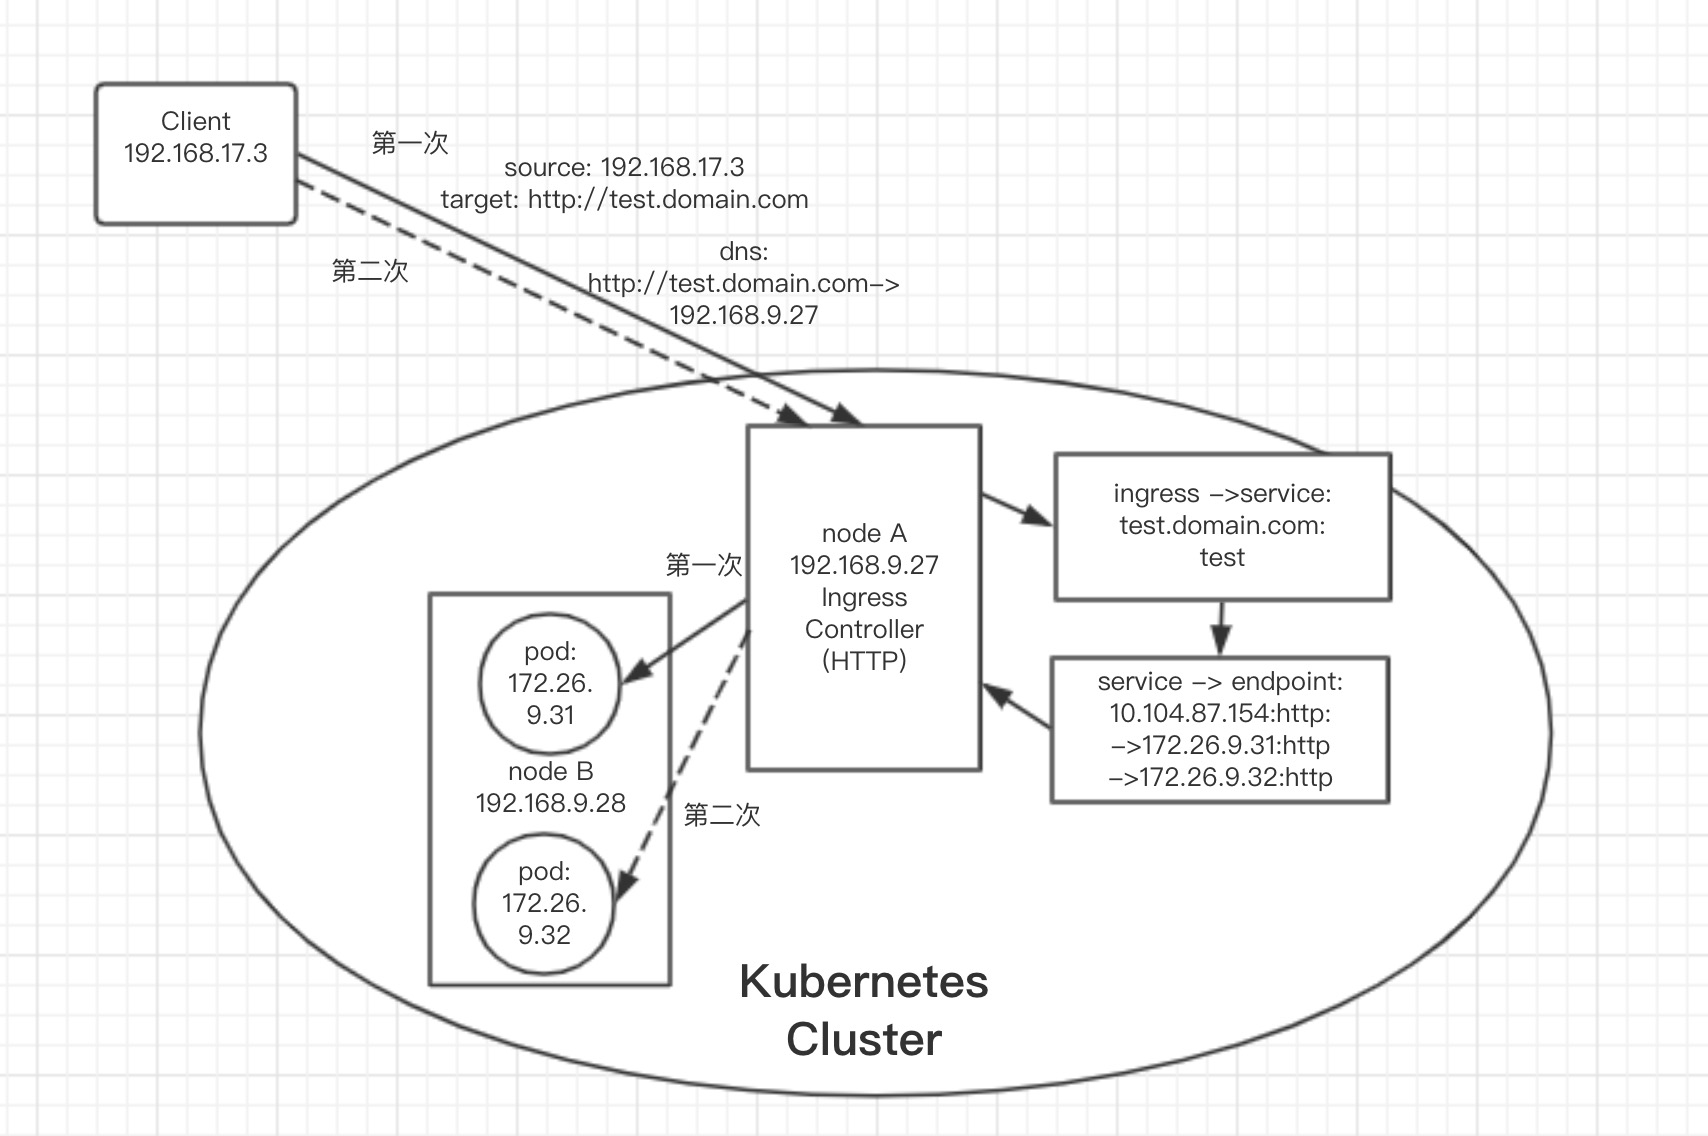
Ingress Gateway入口web代理方案(七层http协议):
环境:
1 | client: 192.168.17.3 |
部署好pod上的http服务后,首先在client端发起两次curl请求,同时在ingress gateway入口的主机上抓包:1
2
3
4
5
6
7
8
9
10
11
12
13
14
15
16
17
18
19
20
21
22
23
24
25
26
27
28
29
30
31
32
33$:~# tcpdump host 10.104.87.154 or host 172.26.9.31 or host 172.26.9.32 or host 192.168.17.4
tcpdump: verbose output suppressed, use -v or -vv for full protocol decode
listening on bond0, link-type EN10MB (Ethernet), capture size 262144 bytes
18:06:36.805139 IP 192.168.17.4.54349 > 192.168.9.200.http: Flags [S], seq 194757065, win 65535, options [mss 1460,nop,wscale 6,nop,nop,TS val 1045875096 ecr 0,sackOK,eol], length 0
18:06:36.805182 IP 192.168.9.200.http > 192.168.17.4.54349: Flags [S.], seq 3062575155, ack 194757066, win 15928, options [mss 1460,sackOK,TS val 1690332192 ecr 1045875096,nop,wscale 6], length 0
18:06:36.805419 IP 192.168.17.4.54349 > 192.168.9.200.http: Flags [.], ack 1, win 2058, options [nop,nop,TS val 1045875096 ecr 1690332192], length 0
18:06:36.805500 IP 192.168.17.4.54349 > 192.168.9.200.http: Flags [P.], seq 1:88, ack 1, win 2058, options [nop,nop,TS val 1045875096 ecr 1690332192], length 87: HTTP: GET / HTTP/1.1
18:06:36.805517 IP 192.168.9.200.http > 192.168.17.4.54349: Flags [.], ack 88, win 249, options [nop,nop,TS val 1690332192 ecr 1045875096], length 0
18:06:36.806109 IP 192.168.9.29.52620 > 172.26.9.32.http: Flags [P.], seq 2174011696:2174011984, ack 1336389137, win 268, length 288: HTTP: GET / HTTP/1.1
18:06:36.807499 IP 172.26.9.32.http > 192.168.9.29.52620: Flags [P.], seq 1:315, ack 288, win 285, length 314: HTTP: HTTP/1.1 403 Forbidden
18:06:36.807520 IP 192.168.9.29.52620 > 172.26.9.32.http: Flags [.], ack 315, win 285, length 0
18:06:36.807764 IP 192.168.9.200.http > 192.168.17.4.54349: Flags [P.], seq 1:287, ack 88, win 249, options [nop,nop,TS val 1690332193 ecr 1045875096], length 286: HTTP: HTTP/1.1 403 Forbidden
18:06:36.807947 IP 192.168.17.4.54349 > 192.168.9.200.http: Flags [.], ack 287, win 2054, options [nop,nop,TS val 1045875098 ecr 1690332193], length 0
18:06:36.808319 IP 192.168.17.4.54349 > 192.168.9.200.http: Flags [F.], seq 88, ack 287, win 2054, options [nop,nop,TS val 1045875098 ecr 1690332193], length 0
18:06:36.808393 IP 192.168.9.200.http > 192.168.17.4.54349: Flags [F.], seq 287, ack 89, win 249, options [nop,nop,TS val 1690332193 ecr 1045875098], length 0
18:06:36.808586 IP 192.168.17.4.54349 > 192.168.9.200.http: Flags [.], ack 288, win 2054, options [nop,nop,TS val 1045875098 ecr 1690332193], length 0
---------------------------
18:07:03.718999 IP 192.168.17.4.54356 > 192.168.9.200.http: Flags [S], seq 2867048974, win 65535, options [mss 1460,nop,wscale 6,nop,nop,TS val 1045901890 ecr 0,sackOK,eol], length 0
18:07:03.719049 IP 192.168.9.200.http > 192.168.17.4.54356: Flags [S.], seq 3283487703, ack 2867048975, win 15928, options [mss 1460,sackOK,TS val 1690338921 ecr 1045901890,nop,wscale 6], length 0
18:07:03.719350 IP 192.168.17.4.54356 > 192.168.9.200.http: Flags [.], ack 1, win 2058, options [nop,nop,TS val 1045901890 ecr 1690338921], length 0
18:07:03.719464 IP 192.168.17.4.54356 > 192.168.9.200.http: Flags [P.], seq 1:88, ack 1, win 2058, options [nop,nop,TS val 1045901890 ecr 1690338921], length 87: HTTP: GET / HTTP/1.1
18:07:03.719490 IP 192.168.9.200.http > 192.168.17.4.54356: Flags [.], ack 88, win 249, options [nop,nop,TS val 1690338921 ecr 1045901890], length 0
18:07:03.719996 IP 192.168.9.29.50680 > 172.26.9.31.http: Flags [P.], seq 1:289, ack 1, win 268, length 288: HTTP: GET / HTTP/1.1
18:07:03.726891 IP 172.26.9.31.http > 192.168.9.29.50680: Flags [P.], seq 1:315, ack 289, win 285, length 314: HTTP: HTTP/1.1 403 Forbidden
18:07:03.726920 IP 192.168.9.29.50680 > 172.26.9.31.http: Flags [.], ack 315, win 285, length 0
18:07:03.727225 IP 192.168.9.200.http > 192.168.17.4.54356: Flags [P.], seq 1:287, ack 88, win 249, options [nop,nop,TS val 1690338923 ecr 1045901890], length 286: HTTP: HTTP/1.1 403 Forbidden
18:07:03.727542 IP 192.168.17.4.54356 > 192.168.9.200.http: Flags [.], ack 287, win 2054, options [nop,nop,TS val 1045901897 ecr 1690338923], length 0
18:07:03.727796 IP 192.168.17.4.54356 > 192.168.9.200.http: Flags [F.], seq 88, ack 287, win 2054, options [nop,nop,TS val 1045901897 ecr 1690338923], length 0
18:07:03.727896 IP 192.168.9.200.http > 192.168.17.4.54356: Flags [F.], seq 287, ack 89, win 249, options [nop,nop,TS val 1690338923 ecr 1045901897], length 0
18:07:03.728119 IP 192.168.17.4.54356 > 192.168.9.200.http: Flags [.], ack 288, win 2054, options [nop,nop,TS val 1045901897 ecr 1690338923], length 0
通过抓包结果可以得出,ingress gateway web代理的流程大致分为如下5个步骤:
1 | 1.源client http request -> 目的ingress gateway(web) |
整个过程如我们猜想一致,中间并没有经过Service的ipvs或iptables的转发,而是直接将请求转发给了实际的endpoint,所以严格来说,这种方式,只使用了kube-router的pod网段路由,并没有使用其ipvs服务代理.
示意图
总结
通过抓包分析,对kube-router的工作模式会有一个更为具体的认知,熟悉你的cni插件,在遇到集群网络故障排查问题时是极有帮助的,无论使用的是何种cni,一定要对其充分了解才能较放心地使用。